Bitcoin price erased an early move above $82,000 on Sept. 4 as stronger-than-expected US employment data lifted Treasury yields and weakened demand for risk assets.
Summary
- Bitcoin price fell 2.1% on the daily chart after trading as high as $82,281 intraday.
- The $78,800–$79,300 area now serves as the main short-term breakout support.
- 4-hour RSI dropped to 53.45, showing that bullish momentum weakened after the rejection.
- Liquidity clusters near $80,200 and $81,800 could attract price if Bitcoin rebounds.
Bitcoin price reverses after testing $82,000
According to data from crypto.news, Bitcoin (BTC) price briefly climbed above $82,000 on Friday before sellers forced the price back below $80,000, reversing the asset’s earlier gains.
BTC reached an intraday peak of about $82,281 before falling toward $79,224. The Binance daily chart showed an open near $81,270, a low of $78,660, and a price around $79,560 at the time of capture, representing a 2.1% decline for the session.
The reversal followed a sharp rally from Bitcoin’s mid-August base near $62,500. That advance carried the asset through $75,000 and into a consolidation range between roughly $76,000 and $82,000.
Friday’s decline did not completely erase the recent breakout structure. Bitcoin remained close to the $78,800–$79,300 area that had previously acted as resistance before the latest push higher.
A daily close below that zone, however, would increase the risk that the breakout was a short-lived move rather than the start of another advance.
Strong US jobs data weighs on Bitcoin
Bitcoin’s retreat coincided with the release of a stronger-than-expected US employment report, which prompted traders to reassess the likely path of Federal Reserve policy.
US nonfarm payrolls increased by 162,000 in August, well above economists’ expectations, while the unemployment rate remained at 4.1%, according to reports.
The report pushed the market-implied probability of a September Fed rate increase to 65% from 55%, Reuters reported. The benchmark 10-year Treasury yield rose to about 4.77%, while the US dollar also strengthened.
Higher yields can create pressure on Bitcoin because they increase the relative appeal of interest-bearing assets. The stronger labor data also challenged expectations that the Fed could leave rates unchanged after recent signs of cooling inflation.
Broader markets showed a limited but defensive response. The S&P 500 edged lower, while investors continued moving money toward cash-like assets amid higher yields and geopolitical uncertainty. Global money-market funds attracted $46.1 billion during the week through Sept. 2.
US equity funds, meanwhile, recorded $11.12 billion in weekly outflows as investors responded to elevated oil prices, rising yields and tensions involving the US and Iran.
Bitcoin technicals place $78,125 support in focus
The daily chart places Bitcoin below the $81,250 Murray Math level, which is marked as a strong pivot and reversal area. Price tested that zone but failed to establish a daily hold above it.
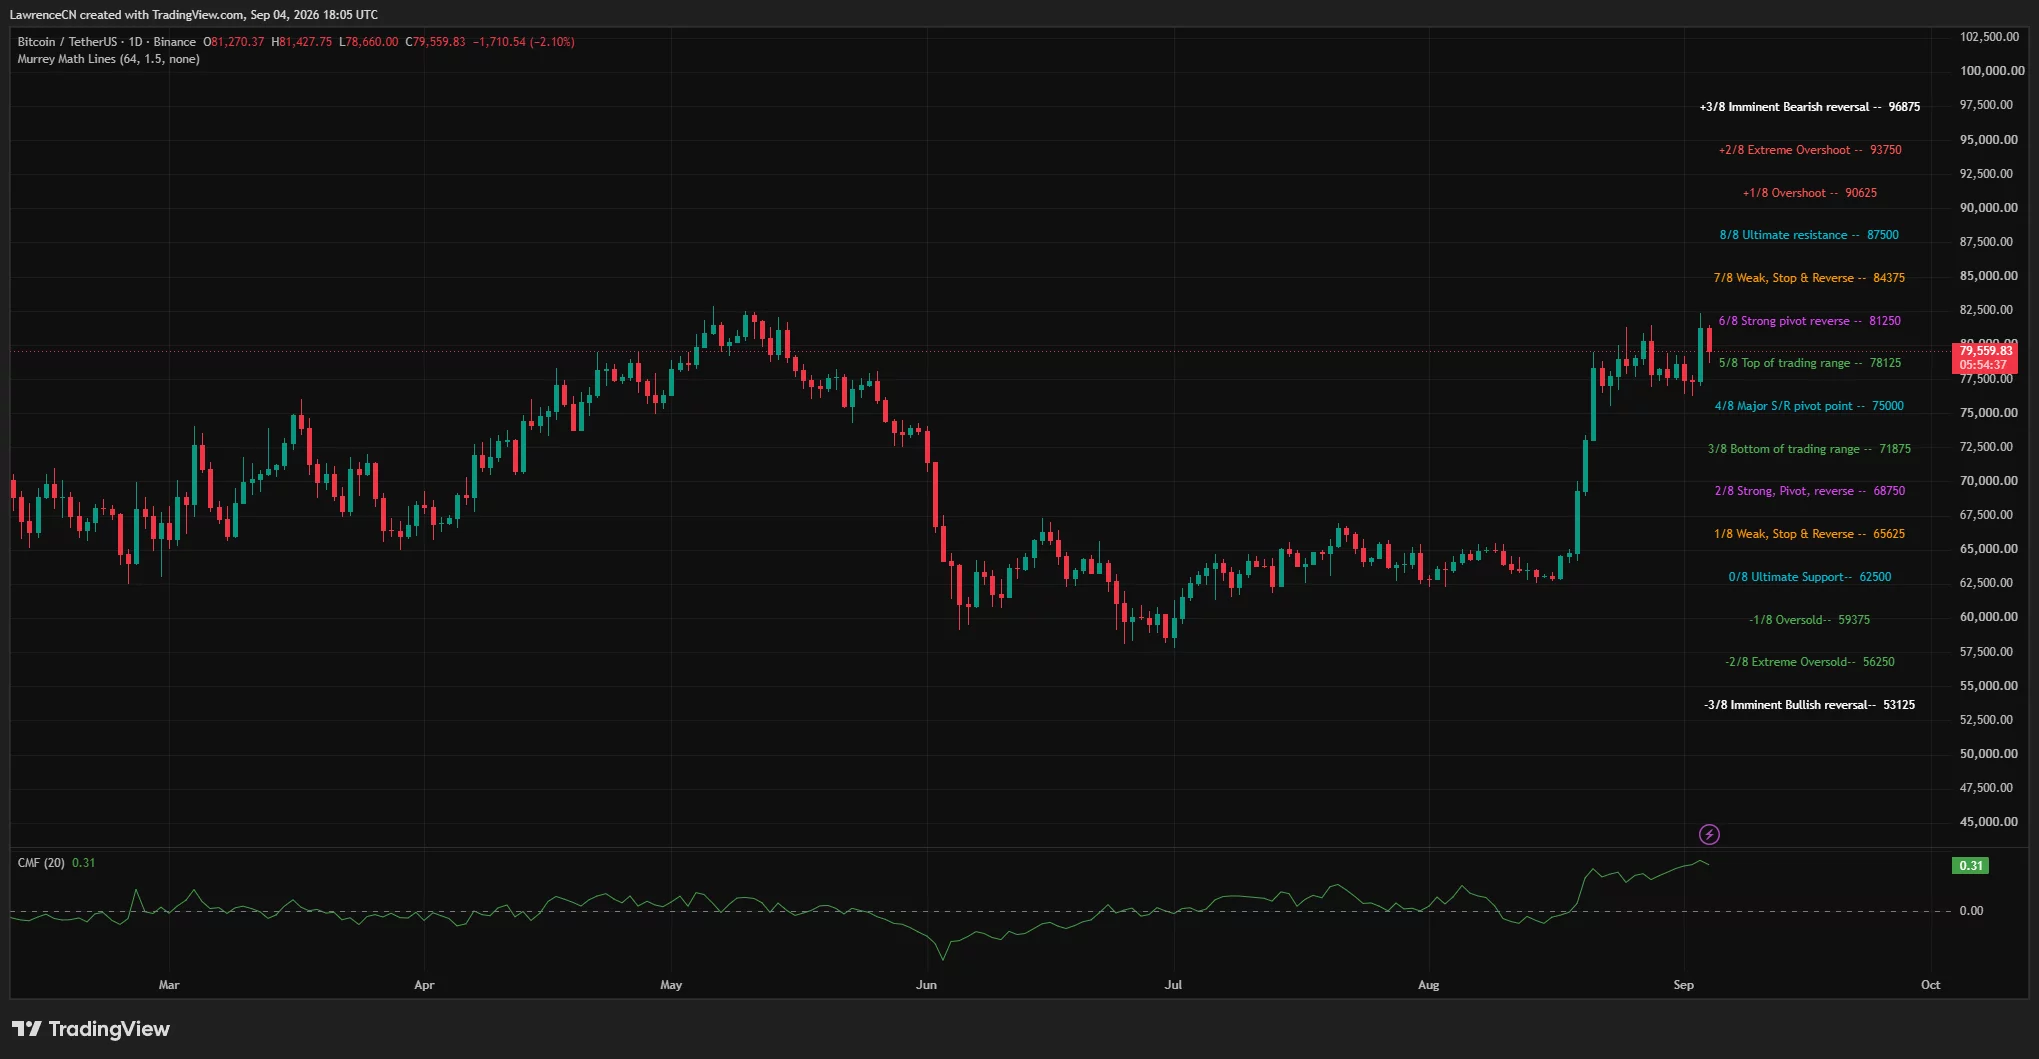
The next visible Murray Math support sits at $78,125, near the breakout-retest area identified by traders. A decisive daily close below $78,125 could expose the psychological $75,000 level, which the chart marks as a major support and resistance pivot.
Below $75,000, the next structural level appears around $71,875. Such a decline would return Bitcoin to the lower portion of its August recovery range, although the charts do not yet confirm a move of that size.
Despite the daily pullback, the Chaikin Money Flow reading remained positive at 0.31. A reading above zero indicates that buying pressure has remained stronger than selling pressure over the indicator’s measurement period, suggesting that the broader rally has not yet lost all of its capital support.
The 4-hour chart presents a more cautious short-term picture. Bitcoin traded near $79,588, above the Bollinger Bands’ middle line at $78,797 but well below the upper band at $82,193.
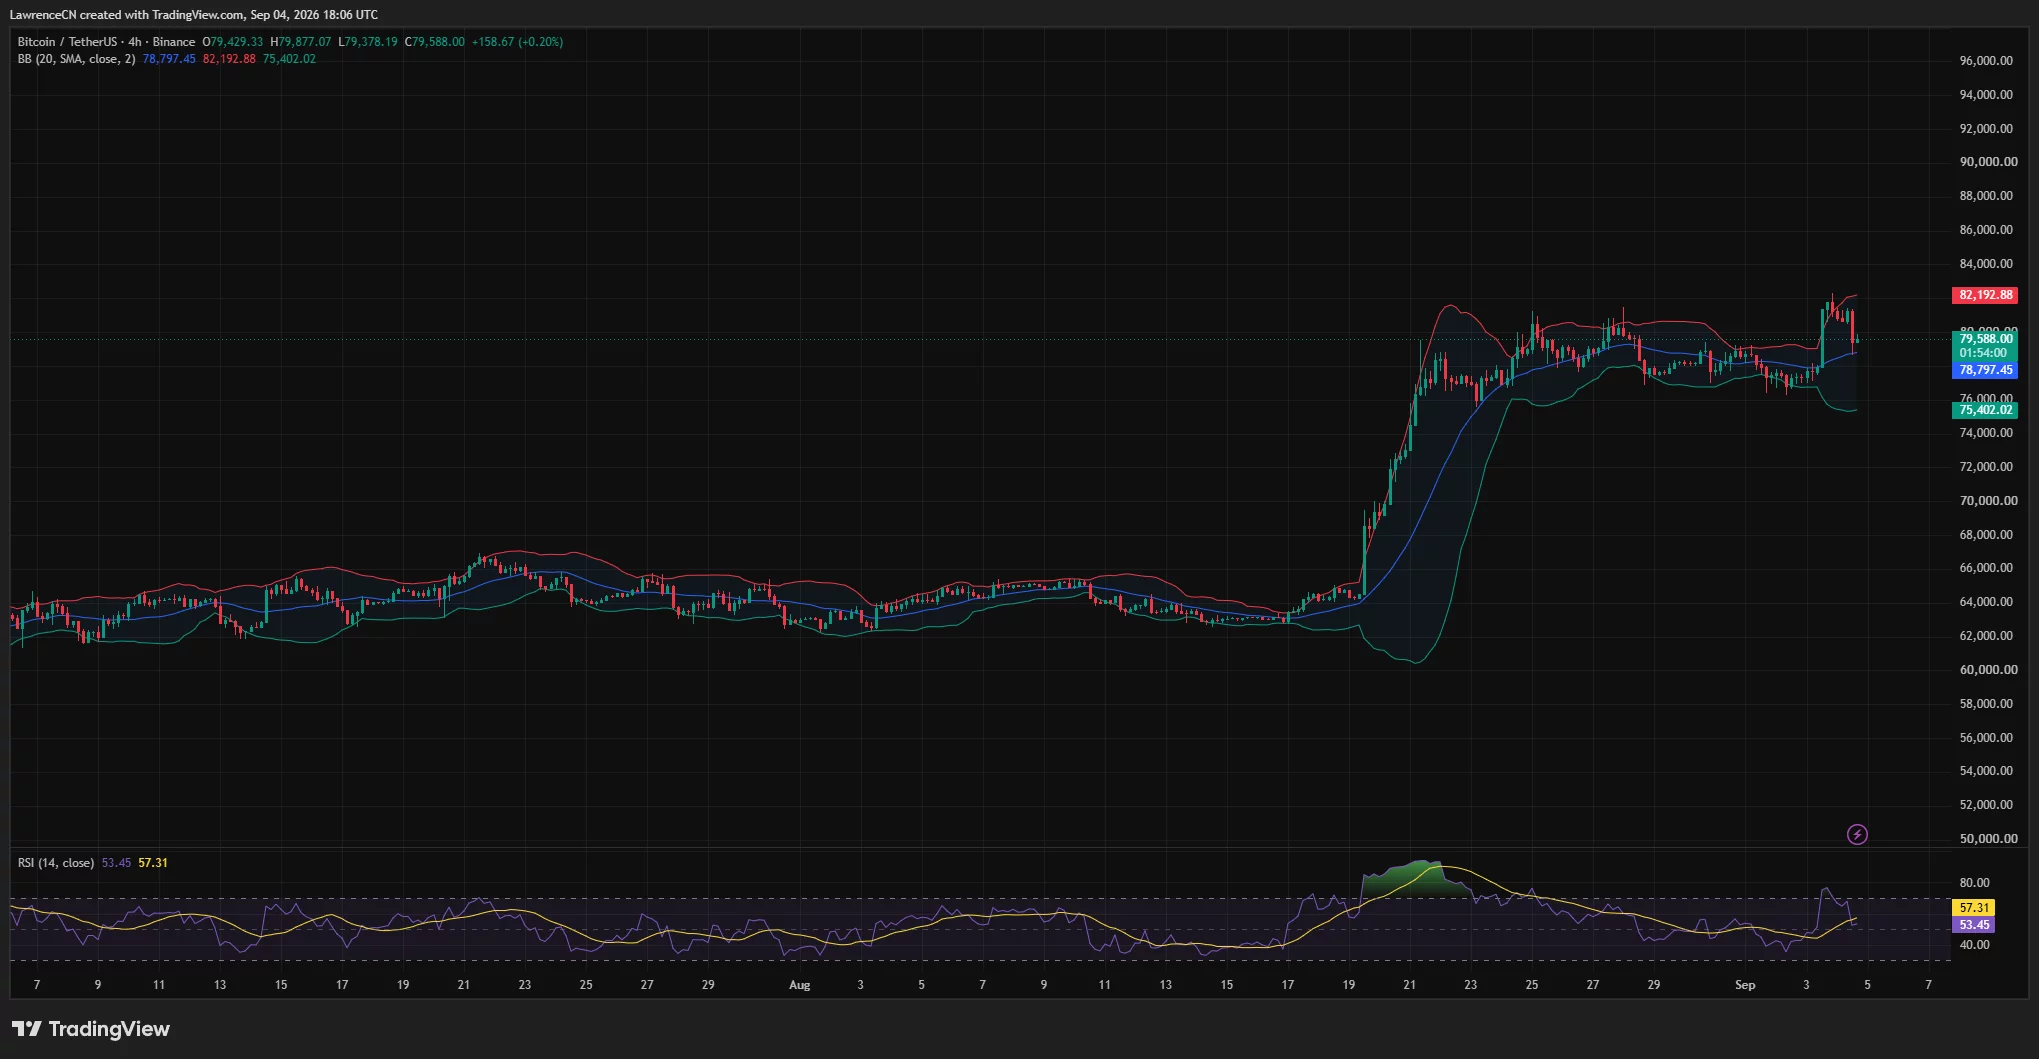
Holding above the middle band would preserve a neutral-to-bullish structure. Losing it could send BTC toward the lower Bollinger Band near $75,402, although the $78,125 and $76,000–$77,000 areas would provide intermediate support.
4-hour RSI stood at 53.45, down from an earlier overbought reading above 70. The indicator remained slightly above the neutral 50 level, but it had fallen below its moving average near 57.31, reflecting weaker momentum after the failed breakout.
Liquidation map shows targets above $80,000
CoinGlass’ 24-hour liquidation heatmap showed concentrated leveraged positions on both sides of Bitcoin’s price.
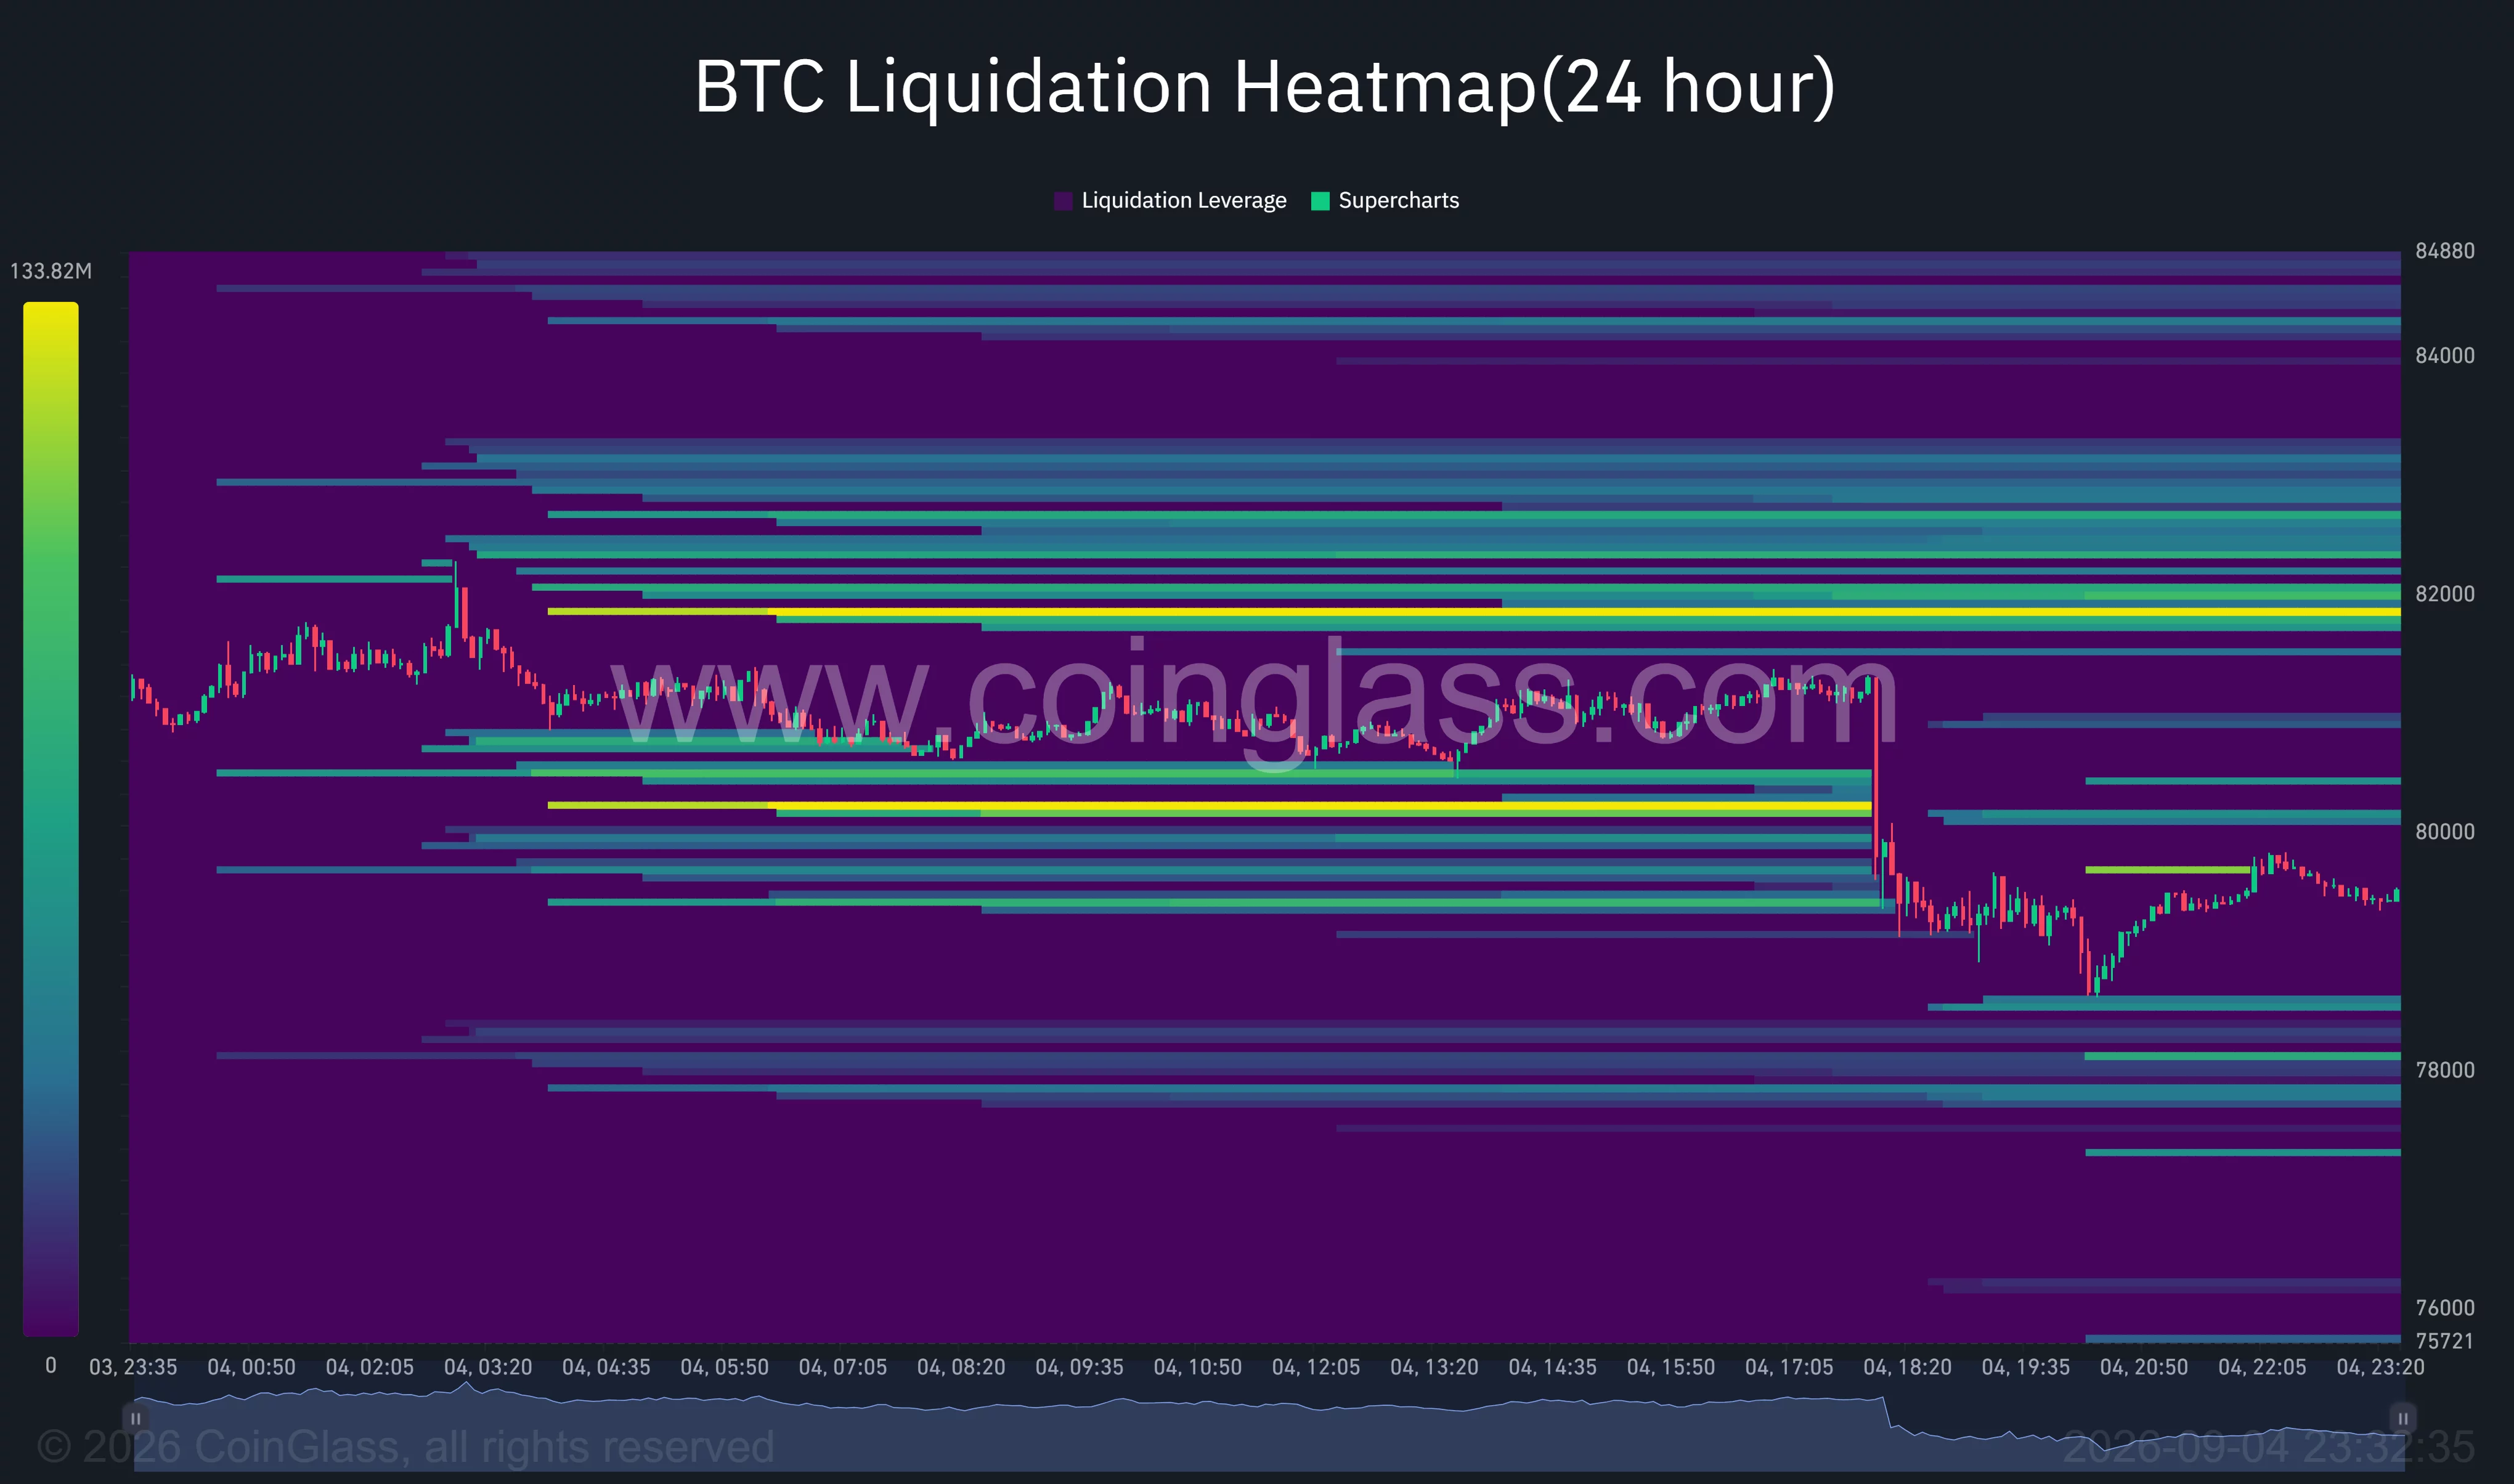
The closest overhead liquidity appeared around $80,000–$80,300, while a larger and brighter cluster was visible near $81,700–$81,900. Those areas could become short-term price targets if buyers push Bitcoin back above $80,000.
Liquidity was also concentrated below the market around $78,000, with additional bands between approximately $77,500 and $77,800. A break beneath the current support zone could therefore accelerate volatility as leveraged long positions face liquidation.
The heatmap does not predict which side Bitcoin will reach first. It instead shows areas where forced position closures may increase once the price enters a dense leverage cluster.
Analysts see $79,000 as the deciding level
Crypto trader Wealthmanager said on X that Bitcoin had broken out of a descending structure before moving directly into the $81,000–$82,000 range. The trader identified $78,800–$79,300 as the breakout-retest zone bulls need to defend.
According to the analyst, holding that area would keep another attempt at $82,000 in play. The view aligns with the 4-hour Bollinger middle line near $78,797 and the daily Murray Math level at $78,125.
Fellow analyst Gerla also identified $79,000 as the key point of control after Bitcoin’s rejection at $82,000. Gerla said holding that level would preserve the breakout structure, while losing it could lead to a rapid move into the $76,000–$77,000 value area.
The immediate setup therefore depends on whether Bitcoin can continue closing above the $78,800–$79,300 region. A rebound through $80,300 would bring the $81,250 pivot and the liquidity cluster near $81,800 back into focus. A confirmed loss of $78,125 would instead increase the probability of a retreat toward $76,000–$77,000, followed by $75,000.
Disclosure: This article does not represent investment advice. The content and materials featured on this page are for educational purposes only.