Dogecoin price held near $0.09 on Sep. 8 after gaining roughly 10% from its Sep. 2 low, while technical and liquidation data pointed to a possible test of $0.092.
Summary
- Dogecoin price recovered from $0.0817 to around $0.090, gaining about 10% from its weekly low.
- DOGE trades above its four main daily moving averages, including the 200-day SMA at $0.08839.
- The three-day liquidation heatmap shows the largest nearby liquidity cluster between $0.092 and $0.0926.
- 4-hour buying pressure remains weak, with the Chaikin Money Flow indicator at minus 0.05.
Dogecoin price holds its weekly breakout
According to data from crypto.news, Dogecoin (DOGE) price traded near $0.0901 at the time of writing, about 10.3% above its Sep. 2 low of roughly $0.0817. The meme coin briefly approached $0.092 during the recovery before entering a narrow consolidation around $0.089–$0.091.
The latest move extended a broader rebound that began after DOGE established a base close to $0.069 in August. A sharp rally later that month carried the token above $0.09, although sellers prevented it from sustaining a move beyond $0.095.
The daily chart shows that buyers defended the $0.080–$0.082 region during the pullback at the beginning of September. DOGE then formed a higher low and recovered above $0.09, leaving its short-term structure tilted upward.
Price action on the 4-hour chart is less decisive. Dogecoin has traded sideways since Sep. 5, with repeated attempts to break above $0.091–$0.092 meeting selling pressure. The narrow range suggests that traders are waiting for enough momentum to challenge the next liquidity zone.
The weekly recovery is partly due to short covering after traders built bearish positions around the early-September low. However, the liquidation heatmap alone does not confirm how much of the rally resulted from forced short closures.
DOGE trades above its key daily averages
Dogecoin’s daily chart has improved after the latest rebound. DOGE trades above its 20-day simple moving average at $0.08713 and its 200-day SMA at $0.08839.
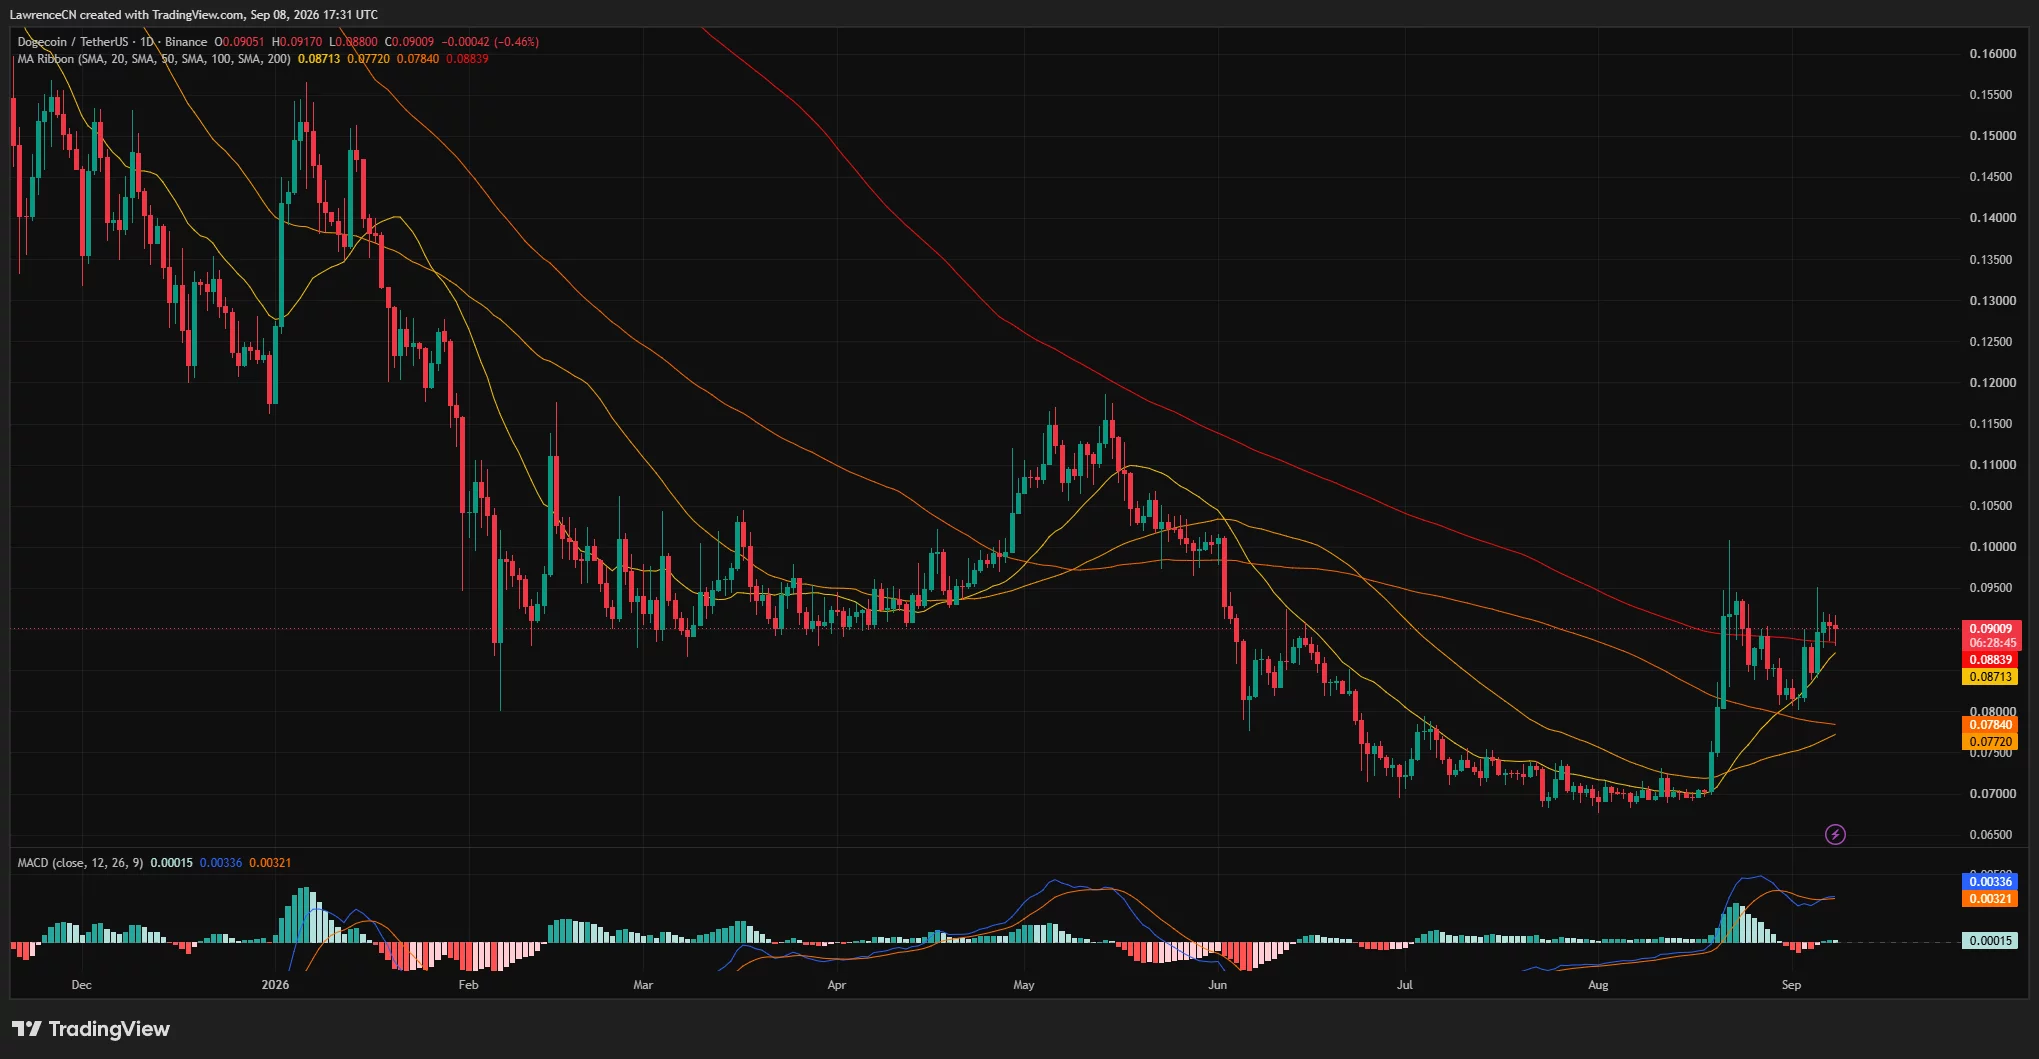
The token has also moved above its 50-day and 100-day averages, shown near $0.07720 and $0.07840, respectively. Holding above the 200-day average would help preserve the recovery, while a daily close below it could weaken the current setup.
The moving averages still reflect a mixed longer-term structure. The 200-day SMA remains above the shorter 20-day average, while both the 50-day and 100-day averages remain well below the market price. DOGE therefore has stronger short-term momentum but has yet to establish a fully aligned bullish trend.
Momentum on the daily chart remains positive but has slowed. The moving average convergence divergence line stood near 0.00336, slightly above its signal line at approximately 0.00321. The histogram was positive at 0.00015, showing that bullish momentum remained in place by a narrow margin.
A widening gap between the MACD and signal lines would support another advance. A bearish crossover, by contrast, would increase the risk of DOGE returning to its moving-average support cluster.
Liquidation map puts $0.092 in focus
CoinGlass’ three-day liquidation heatmap shows the strongest nearby concentration of leveraged positions between approximately $0.092 and $0.0926. Additional liquidity appears around $0.094 and near the top of the chart at $0.0965.
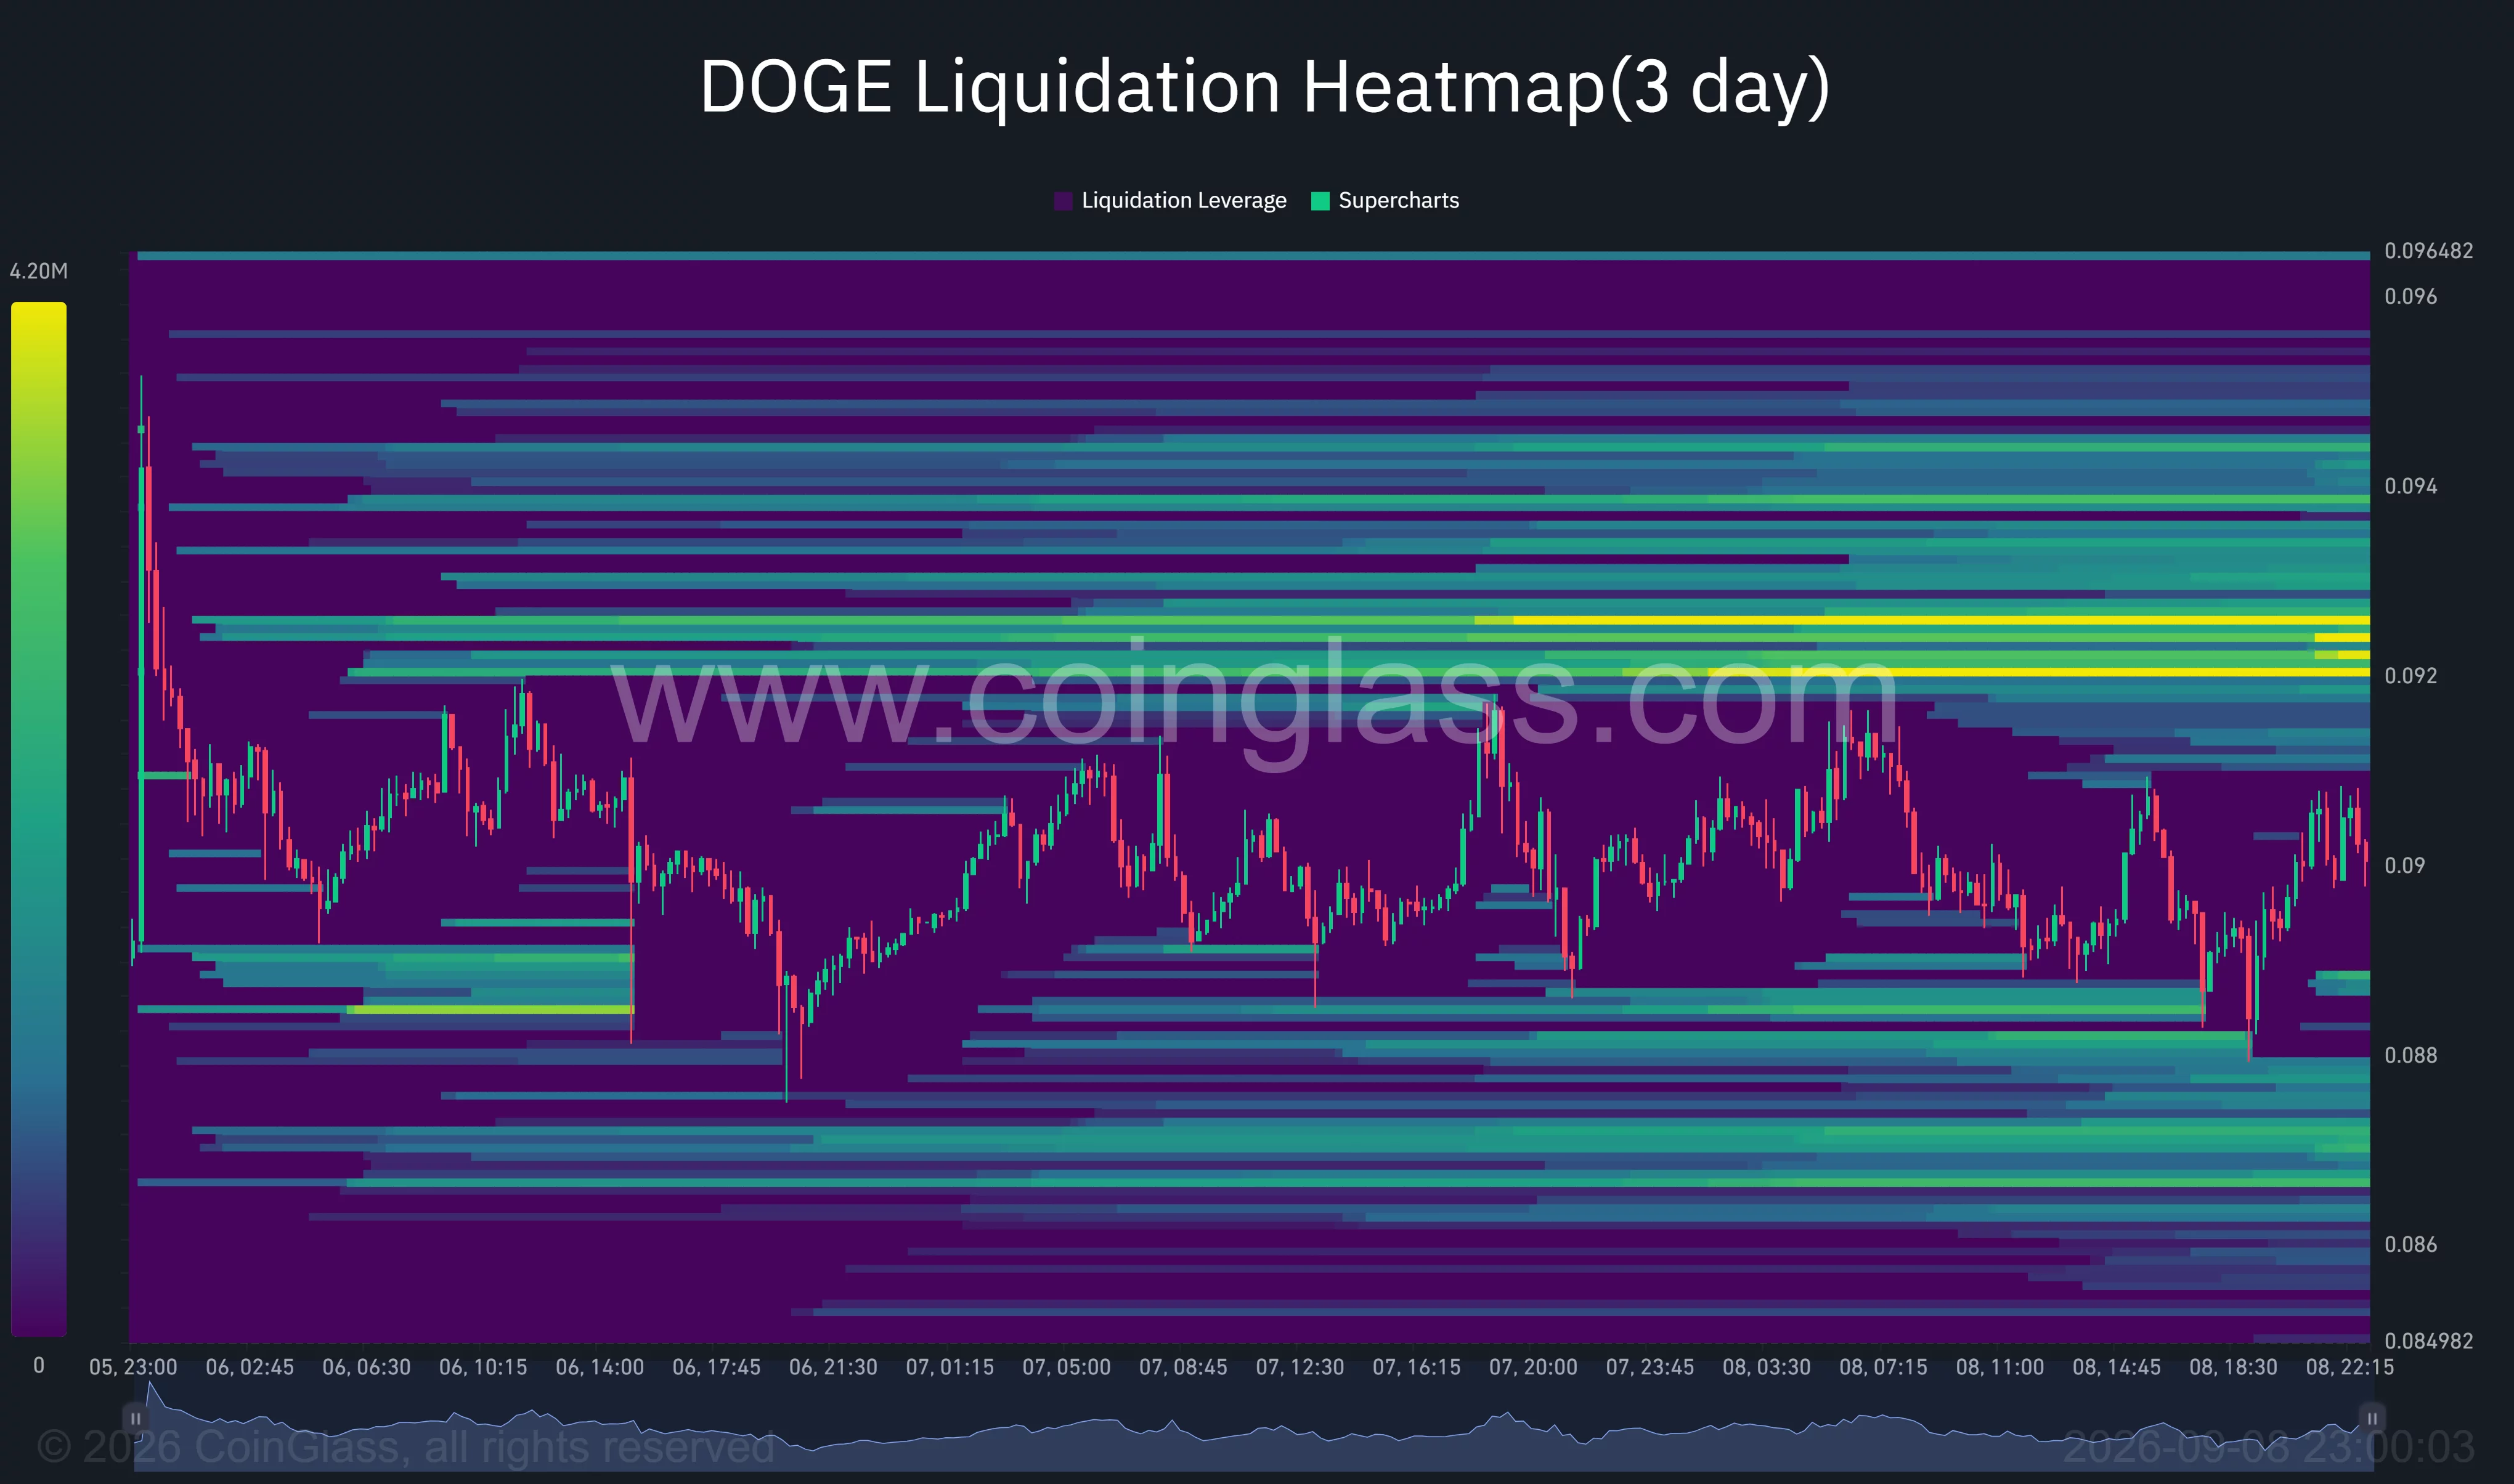
Liquidation clusters can attract price because leveraged positions may be forced to close as the market approaches their trigger levels. They do not guarantee that DOGE will reach those prices, and traders can reposition before a cluster is tested.
A clean move through $0.0926 would expose the $0.094 area, where Dogecoin recorded repeated rejections in late August. Clearing that level could allow bulls to target $0.0965 and the psychological $0.10 mark.
The heatmap also shows liquidity below the market around $0.088, followed by a broader band near $0.087. A decline into those zones could trigger leveraged long liquidations and add to selling pressure.
The placement of liquidity on both sides of the current price leaves DOGE vulnerable to short-term swings. The denser and brighter cluster above $0.092 nevertheless makes that region the most visible immediate target if buyers regain control.
Dogecoin support rests between $0.087 and $0.0884
The first important support is the $0.0884 area, where the 200-day moving average meets a recent breakout level. The 20-day SMA near $0.0871 provides the next layer of support.
On the 4-hour chart, the Supertrend remains bullish, with its support line near $0.08467. Dogecoin has stayed above the indicator since rebounding from its early-September low, but a close below $0.0847 would invalidate much of the latest short-term recovery.
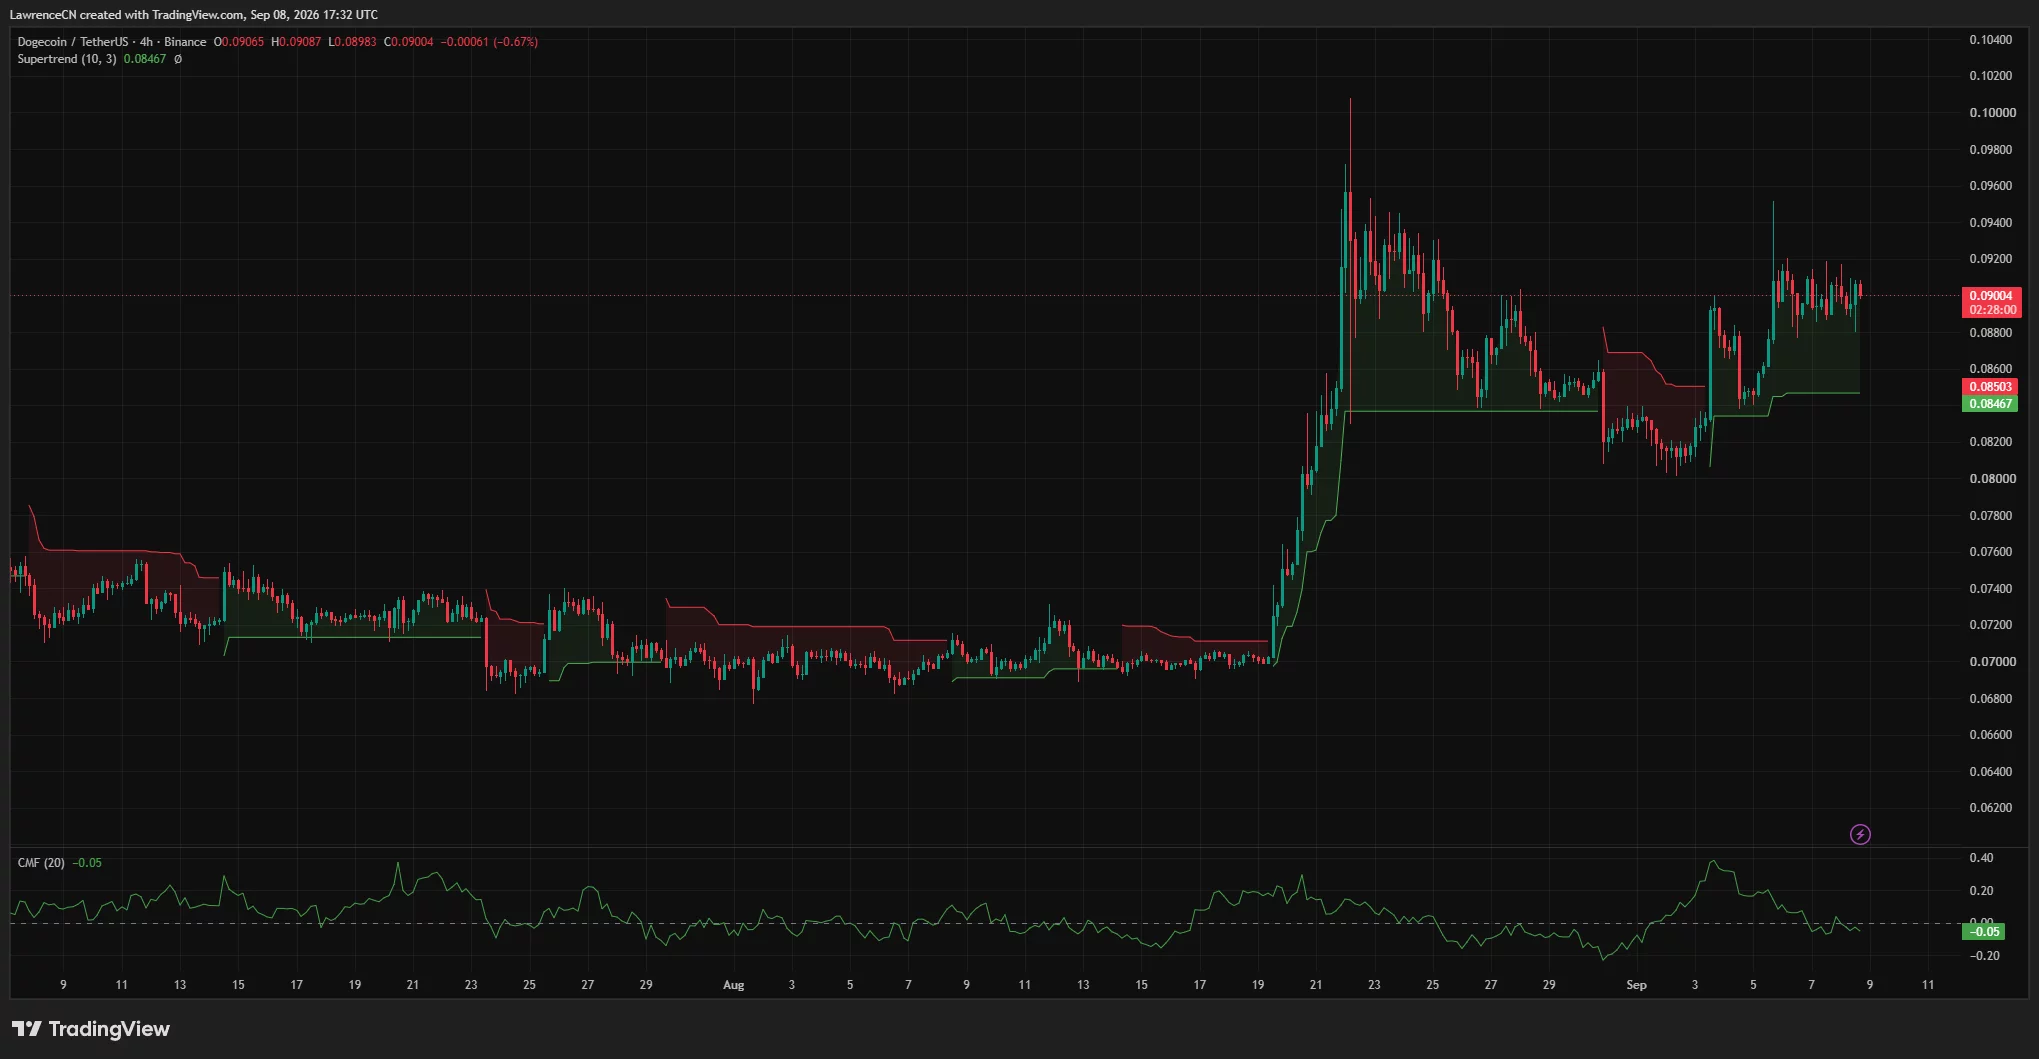
Buying pressure does not yet confirm a strong breakout. The 4-hour Chaikin Money Flow reading stood at minus 0.05, indicating that capital flow was slightly negative despite DOGE holding near $0.09. A move above zero would provide stronger evidence that buyers are supporting the advance.
The bullish scenario requires DOGE to hold above $0.0884 and break the $0.092–$0.0926 resistance band. Such a move would bring $0.094, $0.0965, and eventually $0.10 into view.
Failure to hold the daily moving-average cluster would shift attention toward $0.0871 and $0.0847. A deeper decline below the Supertrend support could expose the recent swing-low region between $0.080 and $0.082.
US macro pressure could limit the DOGE rebound
The shifting US interest-rate expectations are a risk for Dogecoin and other speculative assets. Higher Treasury yields or stronger expectations for tighter Federal Reserve policy can reduce demand for non-yielding assets, although the effect varies across trading sessions.
Dogecoin also remains sensitive to Bitcoin’s direction because broader crypto sell-offs often weigh more heavily on high-volatility altcoins. Continued weakness in Bitcoin could make it harder for DOGE to clear the liquidation cluster above $0.092.
The charts leave Dogecoin at a technical decision point. DOGE has reclaimed its main daily moving averages, but weak 4-hour capital flows and concentrated liquidity on both sides of the market mean a confirmed break above $0.0926 is still needed to extend the recovery.
Disclosure: This article does not represent investment advice. The content and materials featured on this page are for educational purposes only.